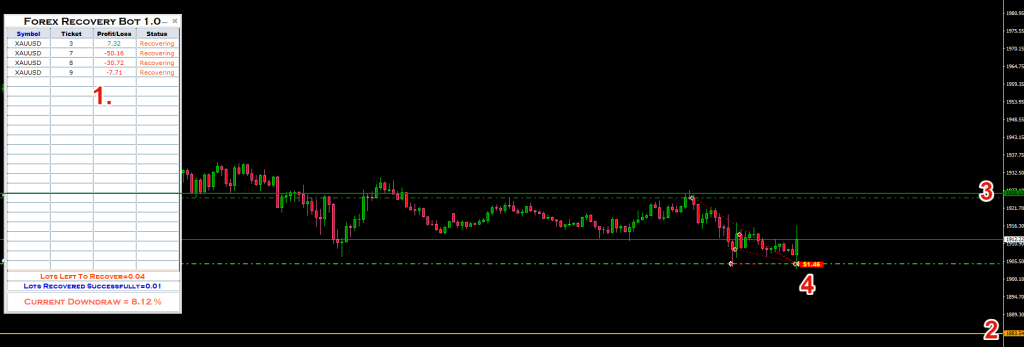
- At the top left corner of the chart you will see a window where the bot displays all trades open on your account, and the status (watching, recovering, or waiting). Additionally at the bottom of the window you will see the number of lots recovered successfully, lots left to recover, and your account’s current downdraw.
- The yellow line is the take profit price for which bot the use to close all sell recovery orders, plus a part of the original losing order that it is recovering.
- The green line is the take profit price for which bot the use to close all buy recovery orders, plus a part of the original losing order that it is recovering.
- When the bot closes a recovery order basket it will draw the profit on chart.